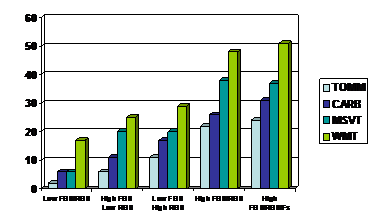
If so, see Roger Gervais, P. Lees-Haley & Y. Ben Porath’s poster on jointly using FBS and RBS to get better prediction of cognitive symptom exaggeration. For the poster click links.
2007 handout GERVAIS
2007 poster NAN GERVAIS
NAN 2007 Handout
NAN 2007 Handout
In the graph, bars show percent failing SVTs. Bar 2 is “High FBS/Low RBS” and bar 4 is”High FBS/High RBS”. Note the difference in SVT failures in these two groups. The first group is “Low FBS/Low RBS” and the fourth group is “High FBS/High RBS”.

